Phase 2 -Network Threat Detection Integration – Suricata + Wazuh
Last updated by: Syed Mahmood Aleem Huzaifa, Last updated on: 29/06/2025
Document Creation: 17 May 2025. Last Edited: 23 May 2025. Authors: Syed Mahmood Aleem Huzaifa.
Effective Date: 23 May 2025. Expiry Date: 23 May 2026.
Overview
Phase 2 covers the integration of Suricata with the Wazuh Manager to enable network threat detection capabilities. It begins with the installation of Suricata on the Ubuntu-based manager system using the official OISF repository to ensure up-to-date packages. Suricata is then configured to output logs in EVE JSON format, specifying relevant event types such as alerts, DNS, HTTP, TLS, and SSH to optimize log relevance and reduce noise. The HOME_NET variable is defined to accurately classify internal traffic, which is essential for proper rule application and threat identification.
The integration continues by modifying the Wazuh Manager's configuration to ingest Suricata logs, ensuring that event data from the network layer is monitored and correlated with existing host-level data. Suricata rules are verified and, if missing, fetched using the suricata-update utility to ensure the engine is actively detecting threats. The success of this integration is validated by generating simulated network attacks using Nmap from another system and checking whether the expected alerts are recorded in the Suricata log file.
This phase ensures that Wazuh is not only capable of host-based monitoring but also equipped to detect and respond to suspicious network behaviour. With Suricata fully integrated, the system gains visibility into intrusion attempts, malware traffic, and other network anomalies, significantly enhancing the overall detection and response capabilities of the security platform.
Step 1: Install Suricata on the Wazuh Manager VM (Ubuntu) using the commands:
sudo apt update

sudo apt install software-properties-common -y

sudo add-apt-repository ppa:oisf/suricata-stable -y

sudo apt update

sudo apt install suricata -y
The command sudo apt install software-properties-common -y installs a package that provides essential tools for managing software repositories, including add-apt-repository. This is necessary when you want to enable external PPAs (Personal Package Archives) not included in the default Ubuntu sources. The command sudo add-apt-repository ppa:oisf/suricata-stable -y then adds the official Suricata stable PPA from the OISF (Open Information Security Foundation) to your system’s list of software sources, ensuring that you can install and receive updates for the latest stable version of Suricata directly from its maintainers. Finally,
sudo apt install suricata -y
installs the Suricata network threat detection engine itself using the package provided by the newly added PPA. The -y flag in these commands is used to automatically confirm prompts during installation. Together, these commands prepare the system to securely and correctly install Suricata from an official and up-to-date source.
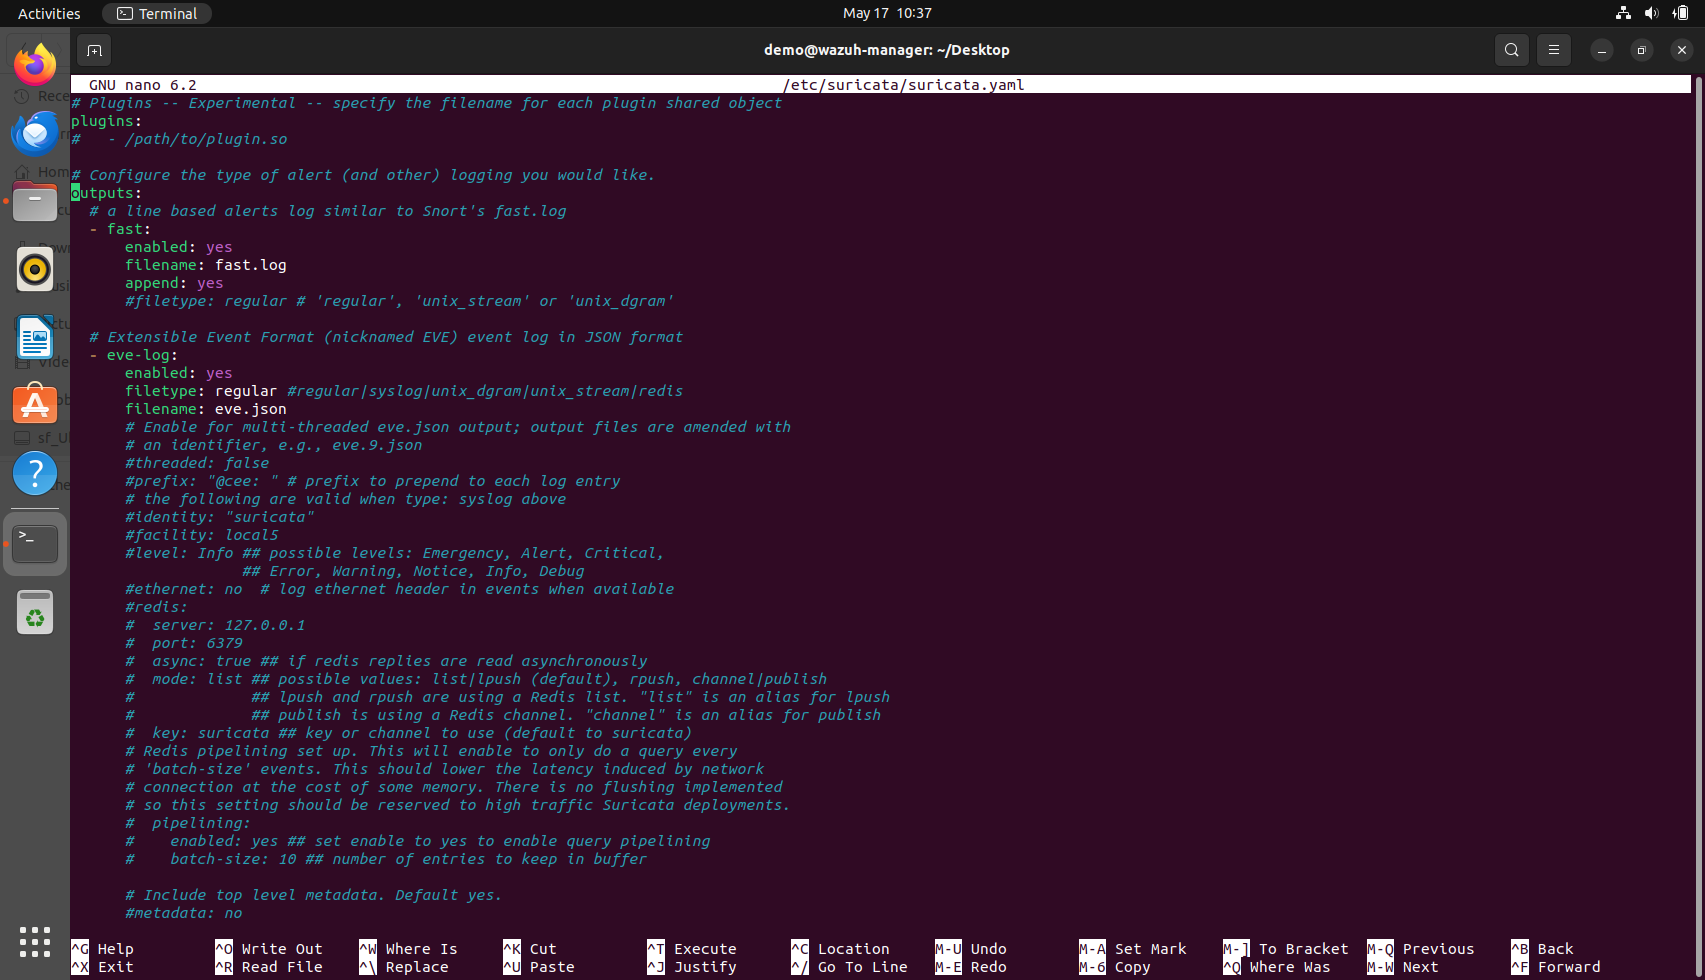
Step 2: Once Suricata is installed, Configure Suricata to Output EVE JSON.
The file can be opened with the command: sudo nano /etc/suricata/suricata.yaml Ensure the following section is configured:
outputs:
  - eve-log:
      enabled: yes
      filetype: regular
      filename: /var/log/suricata/eve.json
      types:
        - alert
        - dns
        - http
        - tls
        - ssh
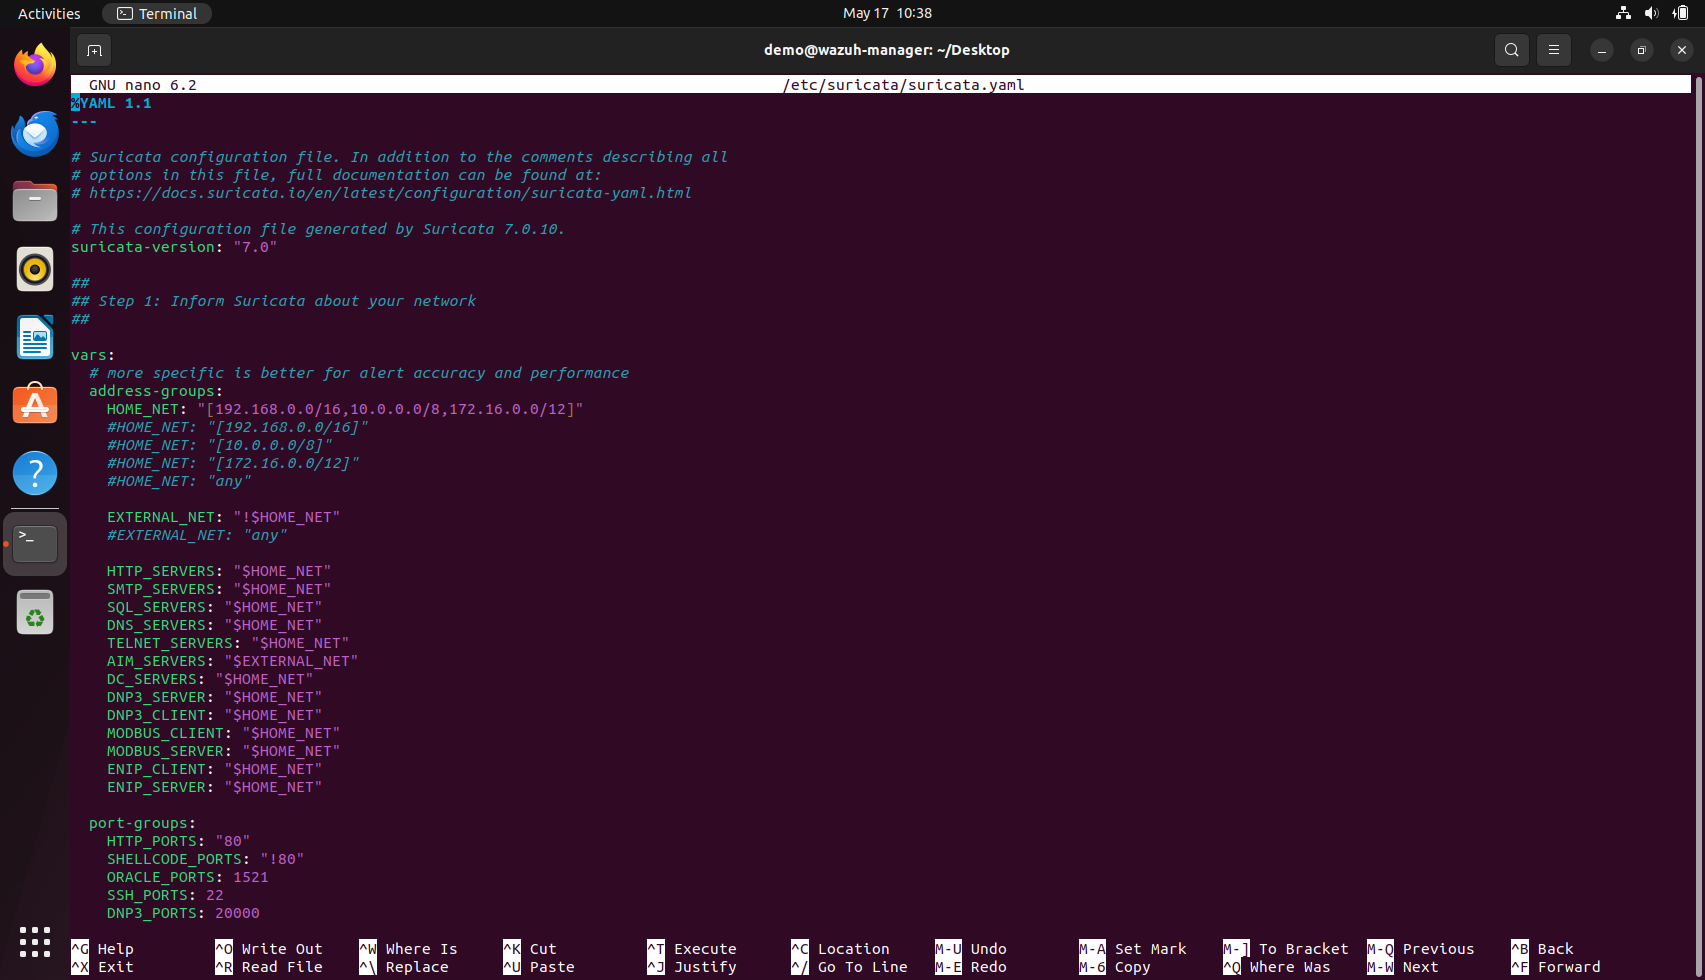
In the Suricata configuration, the HOME_NET variable within the vars → address-groups section is used to define the range of IP addresses considered as internal or protected network assets. This definition plays a pivotal role in determining how traffic is classified and analysed, as many detection rules rely on whether a packet's source or destination belongs to the home network. The value assigned to HOME_NET can either be a single IP address, such as "192.168.0.219", or a broader address range, such as "[192.168.0.0/16,10.0.0.0/8,172.16.0.0/12]", depending on the network topology and monitoring goals. A single IP is typically used in lab setups, isolated sensors, or endpoint-focused deployments where Suricata is tasked with inspecting traffic from or to a specific host. In contrast, specifying CIDR ranges allows for comprehensive visibility across entire subnets, making it suitable for environments monitoring traffic at the gateway, router, or span port level. The decision should be based on the scope of monitoring and the placement of the Suricata sensor within the network infrastructure. Accurately defining HOME_NET ensures that detection rules trigger appropriately and helps reduce false positives by clearly distinguishing internal from external traffic.
%YAML 1.1
---
suricata-version: "7.0"
vars:
address-groups:
HOME_NET: "[192.168.0.0/16,10.0.0.0/8,172.16.0.0/12]"
EXTERNAL_NET: "!$HOME_NET"
HTTP_SERVERS: "$HOME_NET"
SMTP_SERVERS: "$HOME_NET"
SQL_SERVERS: "$HOME_NET"
DNS_SERVERS: "$HOME_NET"
TELNET_SERVERS: "$HOME_NET"
AIM_SERVERS: "$EXTERNAL_NET"
DC_SERVERS: "$HOME_NET"
DNP3_SERVER: "$HOME_NET"
DNP3_CLIENT: "$HOME_NET"
MODBUS_CLIENT: "$HOME_NET"
MODBUS_SERVER: "$HOME_NET"
ENIP_CLIENT: "$HOME_NET"
ENIP_SERVER: "$HOME_NET"
port-groups:
HTTP_PORTS: "80"
SHELLCODE_PORTS: "!80"
ORACLE_PORTS: 1521
SSH_PORTS: 22
DNP3_PORTS: 20000
MODBUS_PORTS: 502
FILE_DATA_PORTS: "[$HTTP_PORTS,110,143]"
FTP_PORTS: 21
GENEVE_PORTS: 6081
VXLAN_PORTS: 4789
TEREDO_PORTS: 3544
default-log-dir: /var/log/suricata/
stats:
enabled: yes
interval: 8
plugins:
outputs:
- fast:
enabled: yes
filename: fast.log
append: yes
- eve-log:
enabled: yes
filetype: regular
filename: eve.json
pcap-file: false
community-id: false
community-id-seed: 0
xff:
enabled: no
mode: extra-data
deployment: reverse
header: X-Forwarded-For
types:
- alert:
tagged-packets: yes
- frame:
enabled: no
- anomaly:
enabled: yes
- http:
extended: yes
- dns:
- tls:
extended: yes
- files:
force-magic: no
- smtp:
- ftp
- rdp
- nfs
- smb
- tftp
- ike
- dcerpc
- krb5
- bittorrent-dht
- snmp
- rfb
- sip
- quic:
- dhcp:
enabled: yes
extended: no
- ssh
- mqtt:
- http2
- pgsql:
enabled: no
- stats:
totals: yes
threads: no
deltas: no
- flow
- http-log:
enabled: no
filename: http.log
append: yes
- tls-log:
enabled: no
filename: tls.log
append: yes
- tls-store:
enabled: no
- pcap-log:
enabled: no
filename: log.pcap
limit: 1000mb
max-files: 2000
compression: none
mode: normal
use-stream-depth: no
honor-pass-rules: no
- alert-debug:
enabled: no
filename: alert-debug.log
append: yes
- stats:
enabled: yes
filename: stats.log
append: yes
totals: yes
threads: no
- syslog:
enabled: no
facility: local5
- file-store:
version: 2
enabled: no
xff:
enabled: no
mode: extra-data
deployment: reverse
header: X-Forwarded-For
- tcp-data:
enabled: no
type: file
filename: tcp-data.log
- http-body-data:
enabled: no
type: file
filename: http-data.log
- lua:
enabled: no
scripts:
logging:
default-log-level: notice
default-output-filter:
outputs:
- console:
enabled: yes
- file:
enabled: yes
level: info
filename: suricata.log
- syslog:
enabled: no
facility: local5
format: "[%i] <%d> -- "
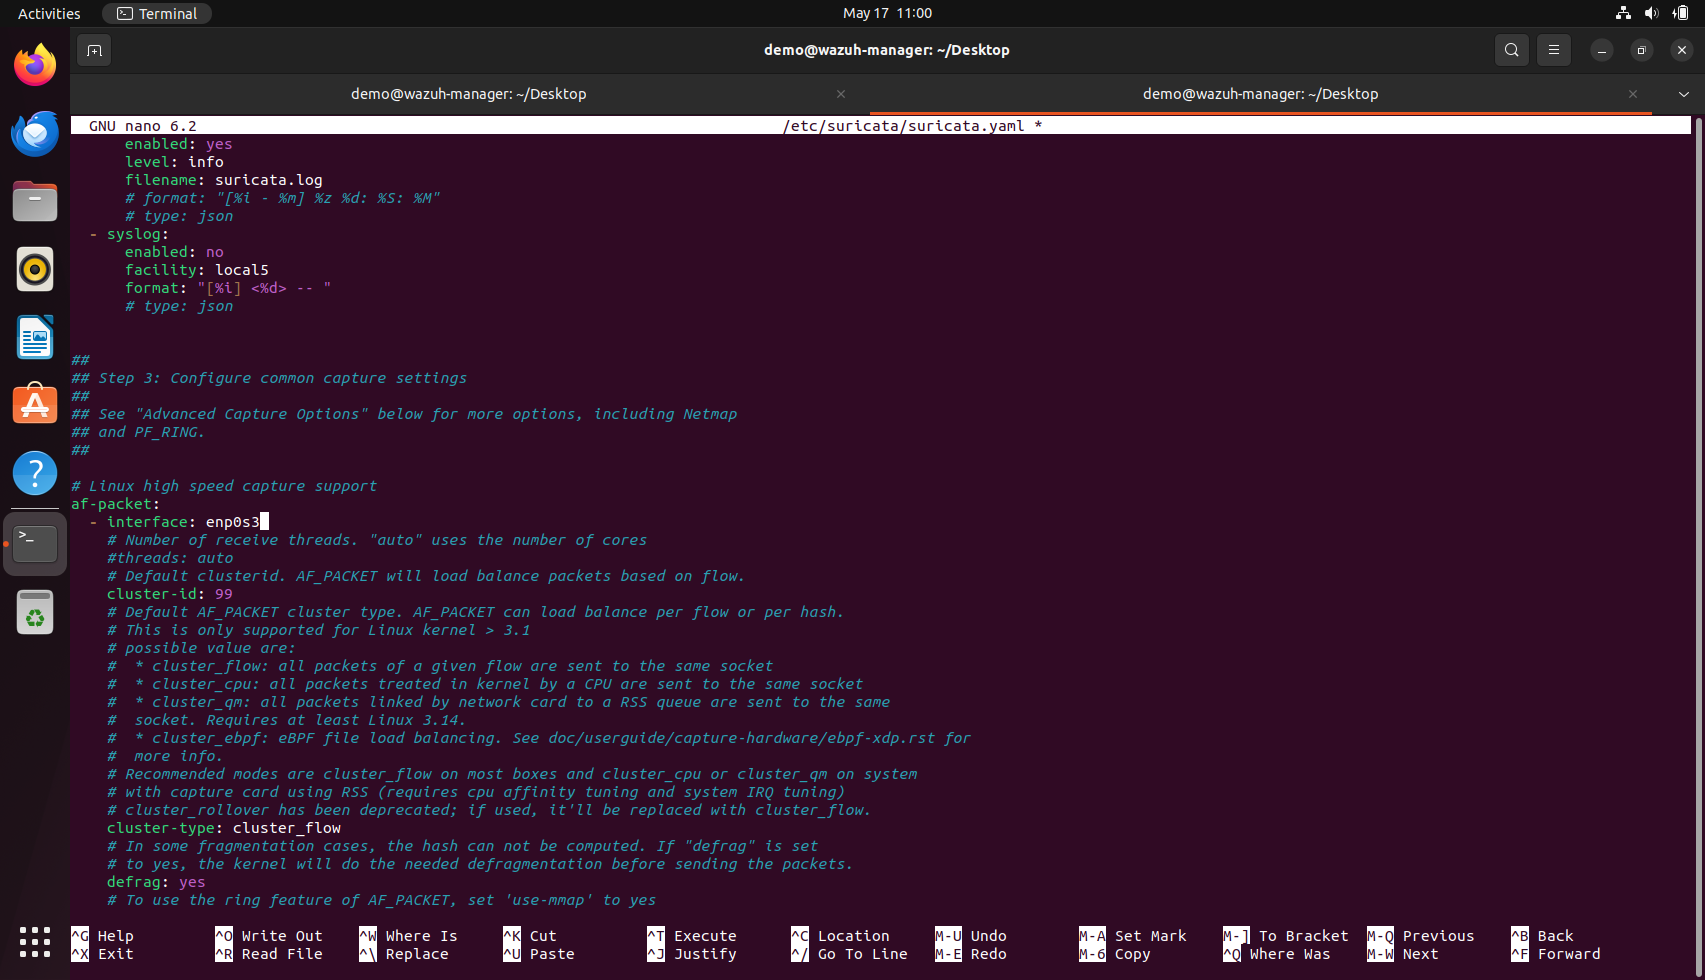
af-packet:
- interface: eth0
cluster-id: 99
cluster-type: cluster_flow
defrag: yes
- interface: default
af-xdp:
- interface: default
app-layer:
protocols:
telnet:
enabled: yes
rfb:
enabled: yes
detection-ports:
dp: 5900,5901,5902,5903,5904,5905,5906,5907,5908,5909
mqtt:
enabled: yes
krb5:
enabled: yes
bittorrent-dht:
enabled: yes
snmp:
enabled: yes
ike:
enabled: yes
tls:
enabled: yes
detection-ports:
dp: 443
pgsql:
enabled: no
stream-depth: 0
dcerpc:
enabled: yes
ftp:
enabled: yes
ssh:
enabled: yes
http2:
enabled: yes
smtp:
enabled: yes
raw-extraction: no
mime:
decode-mime: yes
decode-base64: yes
decode-quoted-printable: yes
header-value-depth: 2000
extract-urls: yes
body-md5: no
inspected-tracker:
content-limit: 100000
content-inspect-min-size: 32768
content-inspect-window: 4096
imap:
enabled: detection-only
smb:
enabled: yes
detection-ports:
dp: 139,445
nfs:
enabled: yes
tftp:
enabled: yes
dns:
tcp:
enabled: yes
detection-ports:
dp: 53
udp:
enabled: yes
detection-ports:
dp: 53
http:
enabled: yes
libhtp:
default-config:
personality: IDS
request-body-limit: 100kb
response-body-limit: 100kb
request-body-minimal-inspect-size: 32kb
request-body-inspect-window: 4kb
response-body-minimal-inspect-size: 40kb
response-body-inspect-window: 16kb
response-body-decompress-layer-limit: 2
http-body-inline: auto
swf-decompression:
enabled: no
type: both
compress-depth: 100kb
decompress-depth: 100kb
double-decode-path: no
double-decode-query: no
server-config:
modbus:
enabled: no
detection-ports:
dp: 502
stream-depth: 0
dnp3:
enabled: no
detection-ports:
dp: 20000
enip:
enabled: no
detection-ports:
dp: 44818
sp: 44818
ntp:
enabled: yes
quic:
enabled: yes
dhcp:
enabled: yes
Including the types of field within the eve-log section of the Suricata configuration is a critical best practice in security monitoring environments, particularly when the system is integrated with SIEM and SOAR platforms such as Wazuh, MISP, TheHive, and Cortex. The types list explicitly defines which categories of events Suricata should output to the eve.json log file, enabling fine-grained control over what data is collected and processed. Common event types include alert for intrusion detection rule matches, dns for DNS query logs, http for HTTP transactions, tls for TLS handshake metadata, ssh for SSH session data, and others such as flow, stats, and files, depending on the network visibility required. In our current setup, the absence of explicitly defined types of list means Suricata defaults to logging all or a broader range of events, which can lead to excessive log volume, increased disk usage, and reduced parsing efficiency within Wazuh. This default behaviour may have been initially retained to simplify deployment or due to oversight, but it is not ideal for a streamlined threat detection pipeline. Defining types not only reduces noise and conserves resources but also ensures compatibility with decoders and rules within Wazuh that expect structured, minimal, and relevant JSON logs. General recommendations for production deployments strongly suggest specifying only those types that are necessary for correlation, detection, and forensic analysis. Doing so helps maintain optimal performance and clarity across all integrated components of the threat intelligence ecosystem.
In the same file, the interface also needs to be updated based on the interface of your system, which can be checked using the command ip a
 Once all the configurations and changes are done as per the requirements, Suricata, similar to Wazuh, needs to be restarted for the new changes to reflect.
This can be done using the command
Once all the configurations and changes are done as per the requirements, Suricata, similar to Wazuh, needs to be restarted for the new changes to reflect.
This can be done using the command sudo systemctl restart suricata
Step 3: Integrate Suricata Logs into Wazuh
Edit the Wazuh manager's localfile configuration: sudo nano /var/ossec/etc/ossec.conf
Inside the <localfile> section, add the following: (If the content of ossec.conf has already been copied from the provided file, then it should have this in it. It is still better to cross-check before moving ahead)
<localfile>
  <log_format>json</log_format>
  <location>/var/log/suricata/eve.json</location>
</localfile>
To integrate Suricata logs with the Wazuh manager, the Wazuh configuration file (ossec.conf) must be updated to instruct it to monitor the Suricata event log. This involves editing the file using a text editor such as nano and adding a <localfile> block that specifies the log format as json and sets the log file path to /var/log/suricata/eve.json, which is where Suricata writes its events. If the configuration file has already been replaced or preconfigured from a known working version, this entry may already be present, but it is still important to verify its inclusion to ensure proper log ingestion.
Restart the Wazuh manager (sudo systemctl restart wazuh-manager)
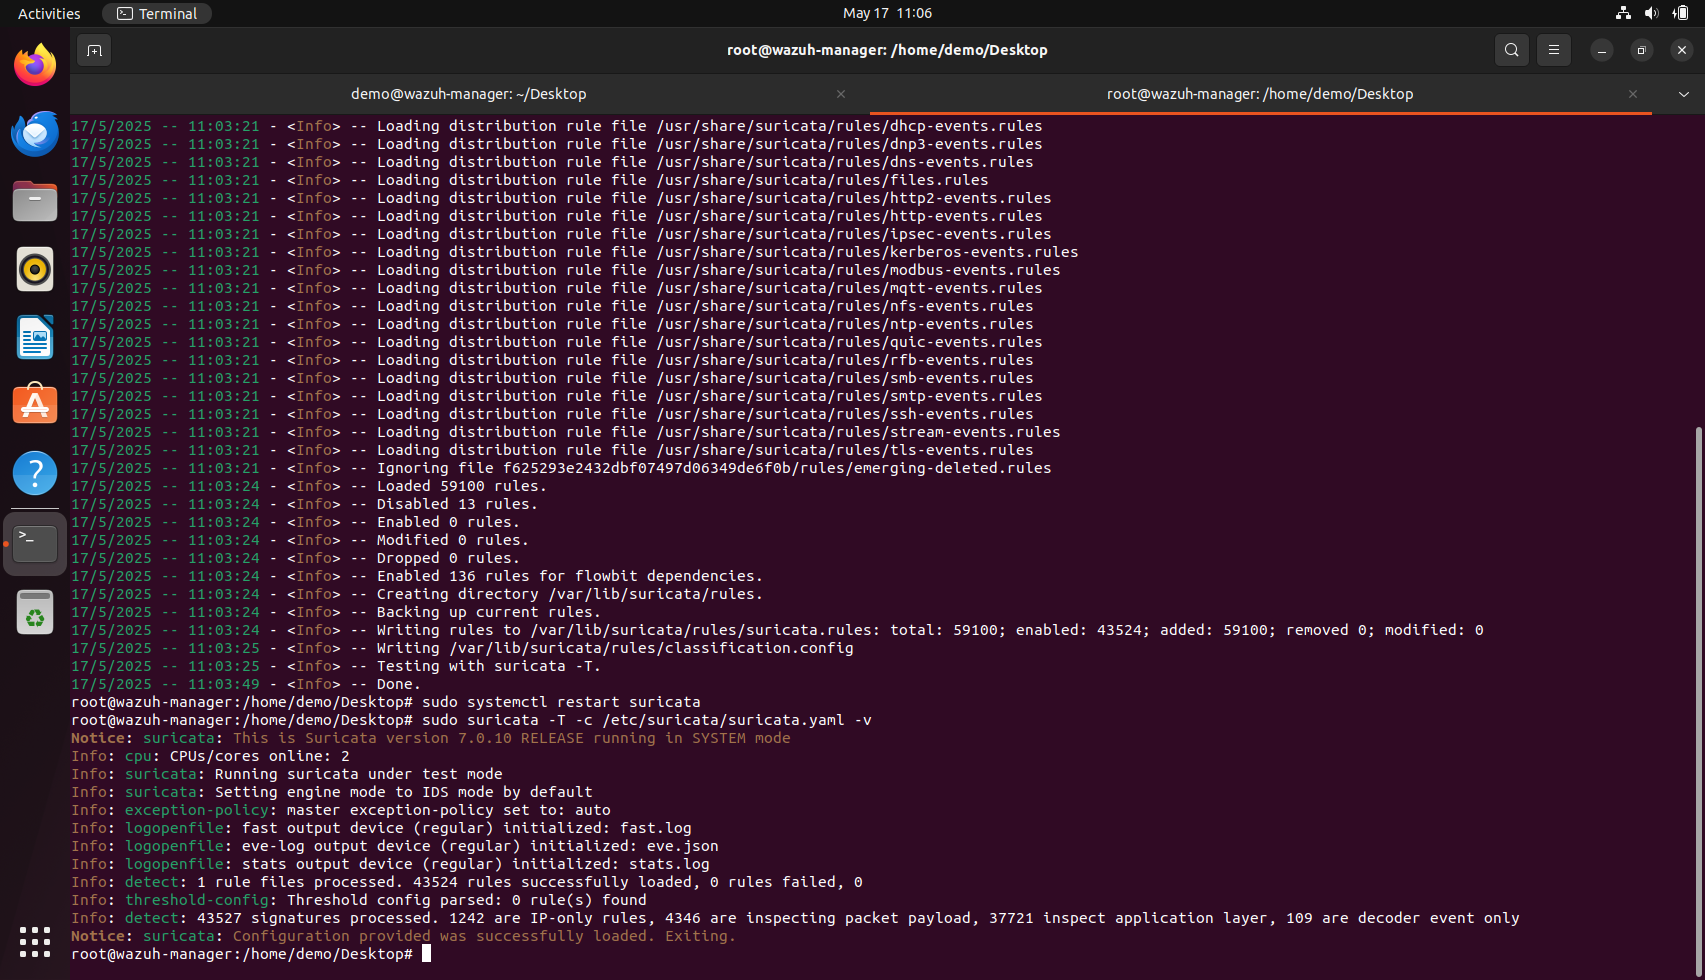
Step 4: Loading Suricata rules
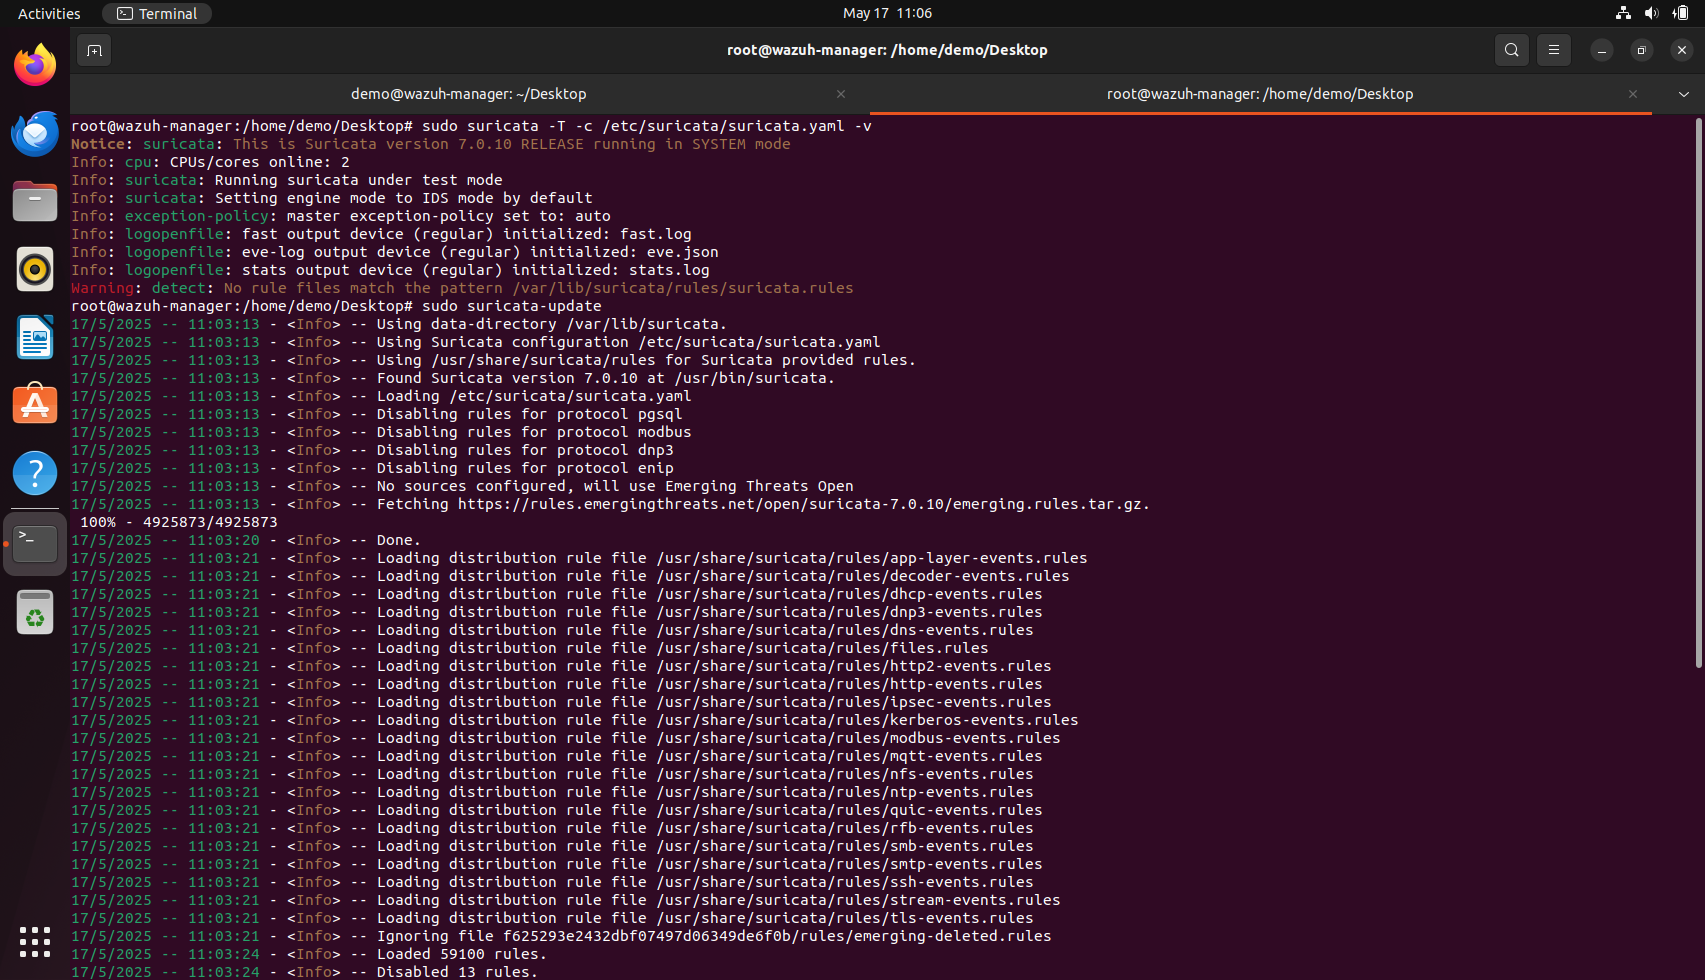
We can check if suricata has rules loaded or not with the command sudo suricata -T -c /etc/suricata/suricata.yaml -v
If it says 0 rules loaded, then we can download all the rules with the command:
sudo suricata-update
Download the rules with the command sudo systemctl restart suricata
Restarts suricata so that the rules downloaded are now loaded
We can now again check if the rules are present using the same command as used earlier, which is sudo suricata -T -c /etc/suricata/suricata.yaml -v
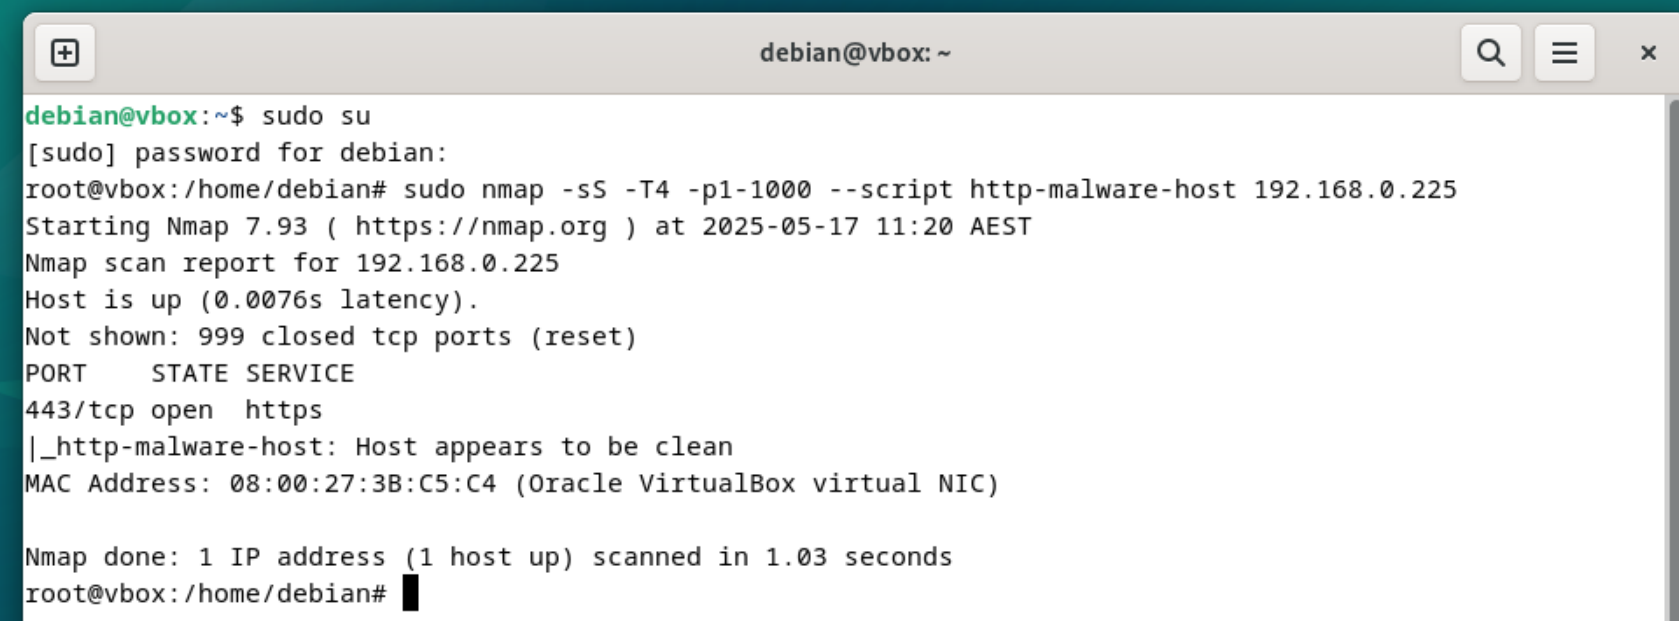
Step 5: Validate Network Alert Ingestion
On another machine, where nmap is installed (can be the agent machine) run the command sudo nmap -sS -T4 -p1-1000 --script http-malware-host 192.168.0.225
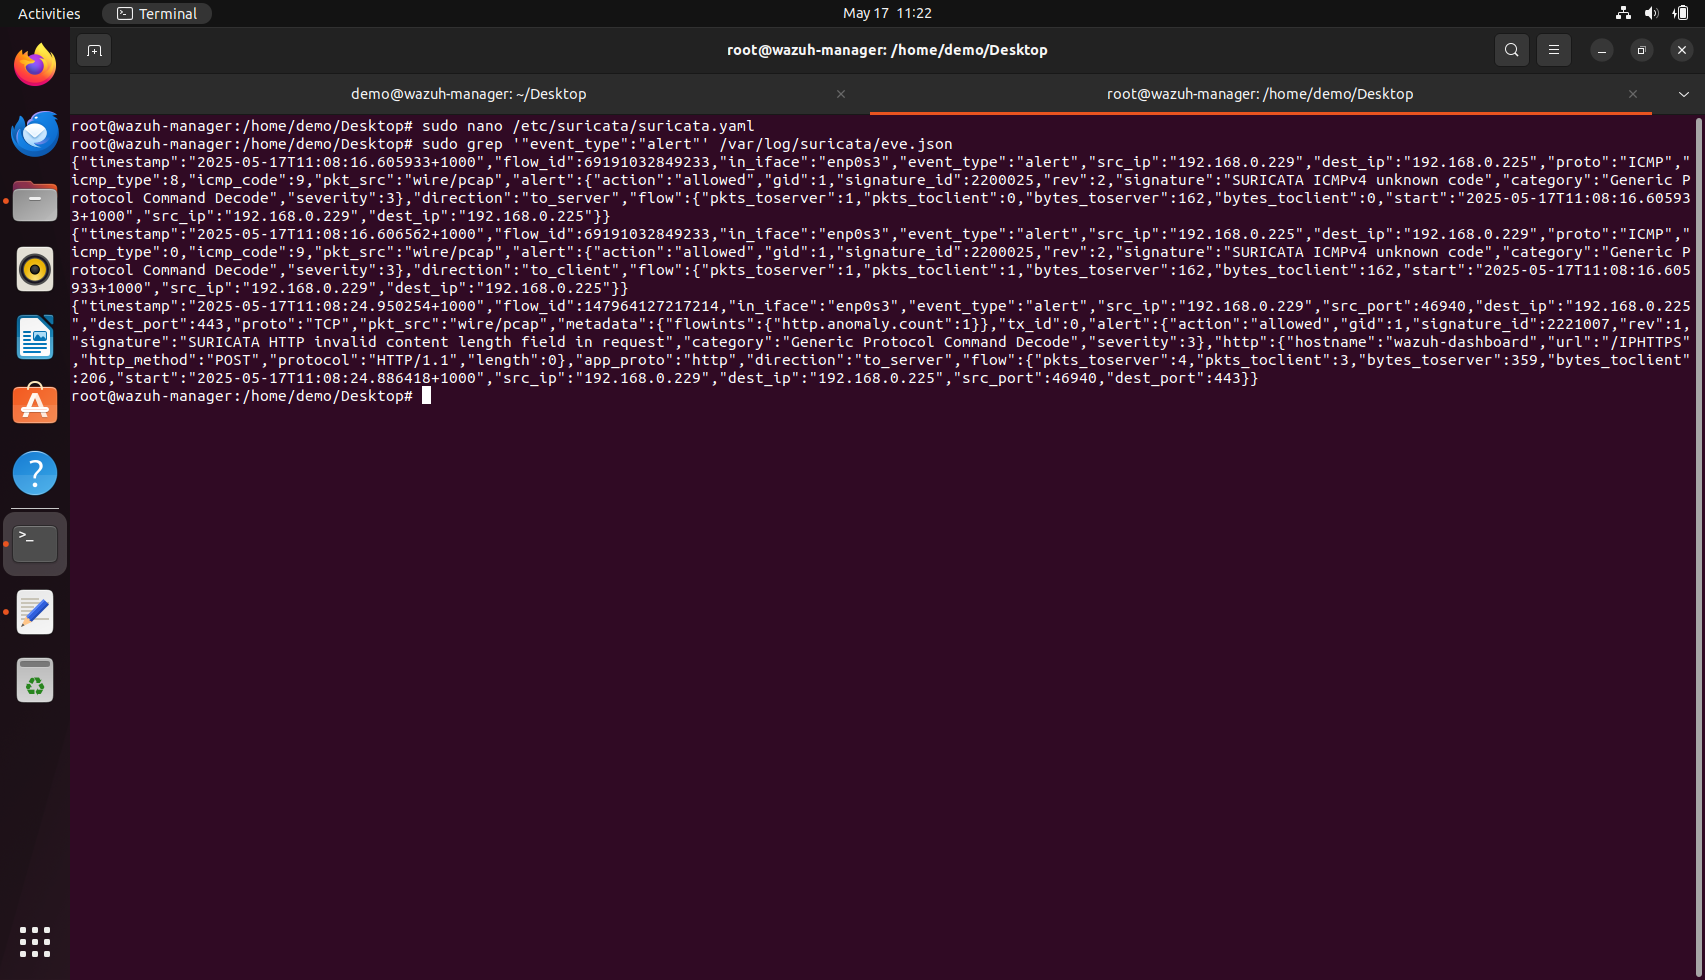
We can now look at the eve.json file to check if Suricata is monitoring the alerts:
sudo grep '"event_type":"alert"' /var/log/suricata/eve.json
In this step, the objective is to validate that Suricata is actively monitoring network traffic and is capable of generating alerts based on known malicious or suspicious patterns. To simulate such traffic, a scan was performed from a separate machine (in this case, the agent system) using the Nmap tool. The specific command used was sudo nmap -sS -T4 -p1-1000 --script http-malware-host 192.168.0.225, which performs a fast TCP SYN scan across ports 1 to 1000 and includes a script to detect HTTP-based malware behaviour. This traffic was directed towards the Wazuh manager machine (running Suricata) to trigger potential alerts.
Users attempting this validation step should ensure that the interface Suricata is monitoring corresponds to the one receiving this simulated traffic. If alerts do not show up immediately, you may be tempted to believe Suricata is not working; however, the absence of alerts can also mean either Suricata is not listening on the correct interface or that no relevant rules are being applied to detect this type of traffic. Therefore, it is important to double-check your HOME_NET and EXTERNAL_NET variables in the suricata.yaml configuration file and ensure the correct network segment is being monitored.
One common issue user might face is a warning during Suricata startup, such as “No rule files match the pattern /var/lib/suricata/rules/suricata.rules.” This essentially means no detection rules have been loaded, which would prevent any alert from being generated regardless of the traffic. If you see this, it's advisable to run suricata-update to fetch and install the default or community ruleset. Once updated, restart Suricata and confirm using the suricata -T -c /etc/suricata/suricata.yaml command that the rules are indeed being loaded, ideally noting the number of rules successfully loaded in the output.
After running the Nmap command, you can verify the alerts by filtering the eve.json log using:
sudo grep '"event_type":"alert"' /var/log/suricata/eve.json.
If everything is working as expected, you should see alert entries such as ICMP packets with unknown codes or malformed HTTP headers being flagged by Suricata. These entries confirm that Suricata is functioning properly and that alerts are being generated and logged.
For users who still don’t see alerts even after applying rules and generating traffic, it is recommended to check the logging configuration under eve-log in the YAML file and confirm that the alert type is enabled. You may also consider enabling additional logging types like dns, http, and tls for broader visibility into what Suricata is observing.